
Oils
We offer to the petroleum-exploration industry a broad range of geochemical and modeling services and products. Let us help you.
Oil Characterization
After SARA, the saturate fraction can be analyzed in much more detail using gas chromatography (GC) and gas chromatography combined with mass spectrometry (GC-MS), which separate the saturate fraction into individual molecular components.

Gas chromatogram of a whole oil. Separation of the saturate fraction was not necessary in this case because the oil was highly paraffinic, with low aromatic, asphaltene, and resin contents.

Top: m/z 217 trace showing steranes in an oil. Middle: m/z 218 trace that also shows steranes in the same oil. Bottom: m/z 191 trace showing triterpanes in the same oil.
GC-MS analysis can also be performed on the aromatic fraction, if desired.
Carbon-isotope ratios can be measured on the whole oil, on any of the SARA fractions, and even on individual compounds. This latter analysis is not common, and is usually limited to the n-alkanes and isoprenoids.
The data from these analyses that characterize an oil can then be used in a number of ways: to help define the organofacies from which the oil was generated; to help estimate which layer is likely to be the source rock; to estimate maturity of the oil; to correlate this oil with other oils, permitting us to divide a group of oils into different oil families, subfamilies, and mixtures, and to correlate oils with their suspected or proposed source rocks. We recommend Biomarkers for Geologists (Waples and Machihara, 1991) and The Biomarker Guide (Peters et al., 2005) as valuable references for interpreting these data.
Oil Correlations
Correlations are comparisons of the properties of two or more samples. Oils can be correlated with other oils, or with source rocks. The objectives of oil correlations are to establish genetic relationships among the samples, which in turn permit us to divide a group of oil samples into families or subfamilies; or to establish a positive or negative genetic relationship between an oil and a suspected source rock.
Oil correlations utilize all available data, placing the greatest emphasis on those data that are least likely to have been affected by non-genetic transformation processes, such as biodegradation, cracking, phase separation, and migration. Bulk properties such as API gravity and sulfur content are therefore of less value than molecular and isotopic parameters (Waples & Curiale, 1999).
The most-valuable correlation data are usually biomarkers, derived from GC-MS analysis. Gas chromatography and carbon isotopes can also be useful.

Left: Gas chromatogram of a sample consisting almost entirely of G. prisca, with the characteristic strong odd-carbon preference from C11 through C19, the lack of n-alkanes above C20, and the absence of pristane and phytane. Right: Gas chromatogram of a sample containing G. prisca and other types of organic matter. The unique G. prisca characteristics are muted, and pristane and phytane are reasonably abundant.

m/z 217 traces (steranes) for two rock samples from the same formation in the same well. Top: Immature sterane distribution showing the true character of the indigenous organic matter in the source rock. Middle: Mature sterane distribution attributed to staining by migrated oil. The large difference in maturity between the oil and the indigenous rock extract (top) indicates that significant migration (vertically or laterally or both) has occurred. In addition, the difference in proportions of C27-C29 regular steranes (triangular diagram, bottom) indicates either that the source rock for the oil is a different stratigraphic unit than where the oil is today (implying at least some vertical migration), or that there is a lateral facies change from the kitchen to the reservoir (migration could be mainly lateral).
Oil Maturity
The thermal history of an oil affects its gross properties in predictable ways: API gravity, saturated hydrocarbon content, and saturate/aromatic ratio increase, while sulfur content, viscosity, wax content, and pour point decrease. However, these parameters are often affected by other factors, such as variations in source-rock facies, biodegradation, phase changes in the reservoir, and migration, and thus cannot always be used quantitatively to evaluate maturity levels of oils. Gas chromatography is slightly more sensitive, but also cannot provide highly quantitative answers. The most reliable way of quantitatively evaluating the maturity of most oils is biomarkers, which are obtained from GC-MS analysis. For extremely mature oils, where the standard biomarkers have been destroyed by high temperatures, diamondoids provide a useful alternative.
Unfortunately, some of the most-commonly used biomarker data are of limited value for oils. The mixture of R and S epimers of extended hopanes normally reaches equilibrium long before oil generation occurs, and thus is not useful at all. Similarly, the mixture of R and S epimers of steranes reaches equilibrium prior to peak generation, and thus often cannot be used to determine precise oil maturity. Aromatic indicators such as the Methylphenanthrene Index (MPI) are valid only for oils that are generated from Type III kerogen, a serious limitation that is often overlooked by interpreters (Matthias Radke, personal communication).
We believe that the most-useful indicators of oil maturity are the Tm/Ts ratio (also expressed as Ts/Tm or Ts/(Tm+Ts)), the sterane/triterpane (or sterane/hopane) ratio, and the absolute concentration of total hopanes (or simply of the C30 hopane) in the sample. None of these ratios is currently very popular, mainly because the values vary from one organofacies (or oil type) to another, and they therefore must be calibrated for each system. Nevertheless, we have had very good success employing these ratios – calibration is generally not difficult, and the results are very consistent and cover a very wide range of oil maturity.
The plot below shows Ts/Tm covarying with the absolute concentration of C30 hopane in a single family of oils. With appropriate calibration data, all these maturity parameters can be linked, at least approximately, to Transformation Ratios in source rocks, and to vitrinite reflectance values.
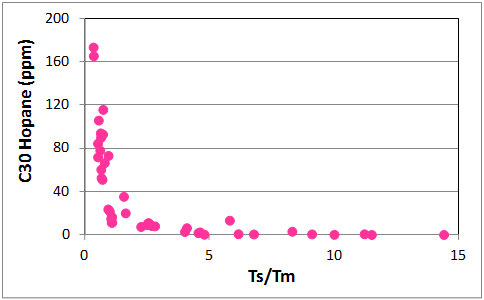
Relationship between Ts/Tm and absolute concentration of the C30 hopane within a single family of oils of widely variable maturity. Least-mature samples have the highest hopane concentrations and lowest Ts/Tm ratios.
Use of biomarkers as thermal indicators is discussed in Waples and Machihara (1991) and Peters et al. (2005), as well as in specialized papers.

SiriusXGC: For subscription information
Including current pricing, Please Contact Us