
Kinetics
We offer to the petroleum-exploration industry a broad range of geochemical and modeling services and products. Let us help you.
Our Kinetics Technology
Sirius Exploration Geochemistry can determine source-rock kinetics in several ways. For new samples, our most-common and preferred method is to use a single pyrolysis run made on an extracted rock sample using data from Rock-Eval, Source Rock Analyzer (SRA), or Hawk at a heating rate of about 25°C per minute. We then specify the A factor that we want to use, and from the pyrolysis data and the specified A factor we derive the activation-energy distribution using the proprietary ORFA software, which was developed jointly with StratoChem Services. For A we can use any value that our client prefers, but we ourselves use ORFA’s default value, which is 2e14 s-1 (Waples, 2000, 2016; Waples et al., 2002, 2010). Numerous tests carried out together with StratoChem have shown that Ea distributions derived from a single pyrolysis run are essentially identical to those derived from the standard three pyrolysis runs. In addition, the one-run kinetics are much quicker and less expensive to generate. As explained elsewhere (Waples, 2016, 2018a), we do not agree with workers such as Peters et al. (2015) who believe that the multirun method for determining kinetics is superior to our one-run method. For further information, visit StratoChem’s ORFA page, and click here to watch our “Defining the Oil-Generation Window using Kerogen Kinetics and Transformation Ratio” video.

Left: Plot showing excellent fit between measured laboratory pyrolysis curve (yellow) and pyrolysis yield predicted from using the kinetic parameters derived by our ORFA software (cyan). Right: Activation-energy distribution derived by ORFA that was used in calculating the cyan pyrolysis curve. The A factor was specified as 2e14 s-1.
An alternative method is to determine the Ea distribution from archived pyrolysis data. This technique can often work very well for data obtained on the Rock-Eval 6, SRA, or Hawk, but is unlikely to be successful using data acquired on the older Rock-Eval 2. The other main disadvantage with archived data is that almost all work was done on unextracted (as-received or NOPR) samples. If those unextracted samples were contaminated or stained by migrated oil, or if large amounts of generation have occurred, it is difficult or impossible to obtain reliable kinetics. The main advantages of the archived data approach are that (1) new samples are not required, (2) it is less expensive than analyzing new samples, and (3) in favorable situations, one can acquire very-large data bases.
A third method is to convert published or previously acquired kinetics data that have an undesirable A factor (i.e., one that is suspect, wrong, or simply undesired), to a new A factor, such as our favored one, 2e14 s-1. This conversion involves a simple algebraic operation that requires neither rock samples nor new laboratory analyses. The conversion process is described in our video Source-rock (kerogen) kinetics: Converting A factors quickly, accurately, and inexpensively. We offer this service at very low cost. This step is always advisable when working with published kinetics data or data generated by other laboratories, and is essential if the original A factor differs significantly from our favored value (Waples, 2018a). Use of kinetics with incorrect A factors (and correspondingly wrong Ea distributions) can cause serious errors in estimating maturity levels in modeling (Stainforth, 2009; Waples, 2018a).

Example of published and converted activation-energy distributions and the corresponding A factors above each diagram. Left: Published data for the Mae Sot kerogen with A = 4.5e12 s-1 (Type I, onshore Thailand [Tegelaar and Noble, 1994]). Right: Converted Ea distribution when A is set to 2e14 s-1.
The importance of using kinetics with a reasonable A factor is clear when we compare the results of modeling at geological temperatures. The example below shows the relationship between Transformation Ratio and Ro for both the original and adjusted Mae Sot kinetics. Exploration conclusions using the two sets of kinetics might be very different.
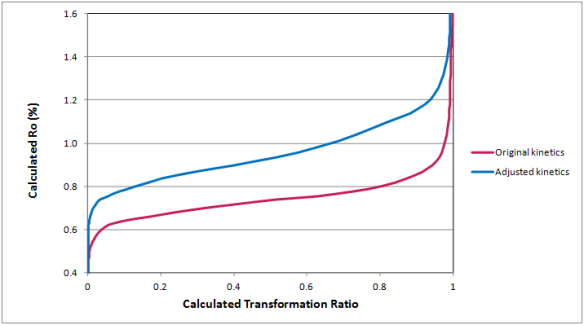
Plot of calculated vitrinite reflectance (Ro) versus calculated Transformation Ratio for the published Mae Sot kinetics with a low A factor (pink line, with generation early, at low Ro values), and for the adjusted Mae Sot kinetics with a higher A factor and correspondingly higher activation energies (blue line, later and at higher Ro values).The practical differences between the two scenarios are quite large.
In our maturity studies we often measure kinetics on partially mature to highly mature samples, where pyrolysis yields and S2 peaks can be rather small. In such cases baseline drift can make quantification of the S2 peak and derivation of reliable kinetics difficult. In other cases, in particular working with unextracted samples, there may be interference from bitumen in the late part of the S1 peak. In any cases where these problems arise, ORFA allows the user to manually adjust the baseline, removing drift and other anomalies, and thus permits acquisition of accurate kinetics data even for difficult samples. The three figures below show an example of S2 yields and Ea distributions derived before and after baseline editing, as well as the editing process in ORFA.

Left: Original S2 peak for a partly mature sample, showing the excellent fit between the pyrolysis data (yellow) and the calculated pyrolysis curve from the kinetics (cyan). Right: Ea distribution derived for this unedited sample. A = 2e14 s-1.

Left: Red S2 peak before editing, with the new baseline at the bottom in blue and the cutting margins shown by the vertical blue lines. Positions of the cut lines are selected by the user using the cursor. Right: Blue edited S2 peak, ready for kinetics determination.

Left: Excellent fit between calculated (cyan) and measured edited S2 data (yellow) for the edited sample shown in the previous figure. Right: Ea distribution derived from the edited pyrolysis data. A = 2e14 s-1.
Finally, ORFA can separate the standard (bulk or total hydrocarbon) kinetics, which don’t distinguish oil generation from gas generation, into separate kinetics for oil and gas. The resulting oil-gas kinetics will give a more-accurate picture of the timing of generation of each phase. This transformation can be applied to any existing Ea distribution. It is an estimate rather than an exact measurement, but it is based on trends of existing data in which such kinetics have been directly measured. Other kinetics software does not offer this option.

Top: Kinetics for the Green River Shale, which generates about 10% gas. Bottom: Kinetics for the Abu Roash “D”, which is a Type III kerogen that generates a higher proportion of gas. Cyan histograms show total hydrocarbon kinetics, while the other two displays divide those kinetics into oil (green) and gas (red) kinetics, displayed in two different formats. All this output was derived using our proprietary ORFA software.

SiriusXGC: For subscription information
Including current pricing, Please Contact Us